


December 29, 2015
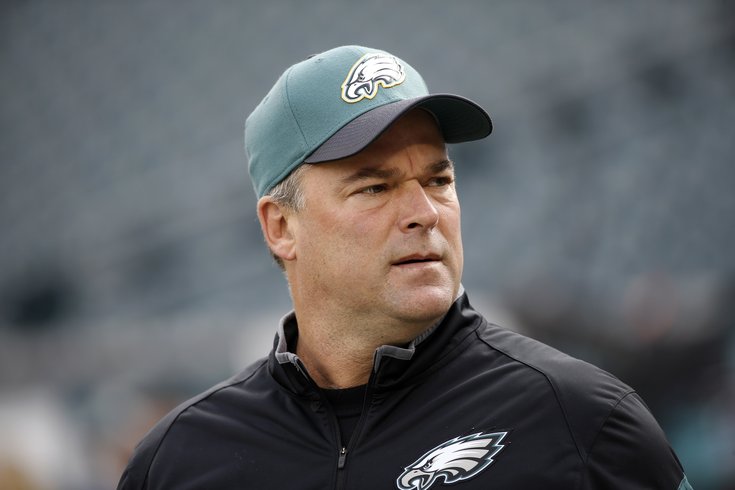
With the Eagles' season over, we began polling our readers on which coaches and players should stay or go in 2016. In the coaching series, there was an overwhelmingly strong push to fire defensive coordinator Bill Davis. Ninety-one percent of over 2000 voters think Davis should be fired, while only 28 percent think Chip Kelly should get the ax.
That is asinine.
While it's easy to look at the three 40-point games the Eagles' defense allowed down the stretch and point to Davis as the scapegoat, the Eagles' defense this season has been better than the offense. That's not to say the defense has been good, mind you, and there is certainly no intent here to defend it in any way here, but the offense has been worse.
Because the Eagles under Kelly run a constant up-tempo offense, their defense is forced to face more drives than any other team in the NFL. In each of his first three seasons with the team, Kelly's offense has been dead last in time of possession per drive, per FootballOutsiders.com:
| Year | T.O.P. per drive | NFL Rank |
| 2013 | 2:09 | Dead last |
| 2014 | 2:07 | Dead last |
| 2015 | 2:09 | Dead last |
When the Eagles score, they score quickly, and when they go three-and-out, you might miss their drive in its entirety if you stop to wash your hands after taking a whiz during the commercial break.
And the defense is paying the price. This, of course, is not a new concept to those who follow the team closely (some buy it, some don't), but let's put some numbers behind it.
In 2013, the Eagles' defense faced 1150 snaps, which was the most in the NFL. In 2014, they faced 1113 snaps, which was the second most in the NFL. So far this season, they have faced 1067 snaps (on pace for 1138), which is once again the most in the NFL.
The 31 other defenses across the league, on average so far this season, have faced 962 snaps. In other words, the Eagles have faced 105 more snaps than the average NFL team, or a little less than two games' worth.
For the second consecutive year, the Eagles D had good moments throughout the season, but crapped the bed down the stretch. In 2014, for example:
| 2014 | Sept | Oct | Nov | Dec |
| Yards allowed/game | 391.3 | 373.3 | 342.0 | 403.5 |
| First downs allowed/game | 22.5 | 19.3 | 18.6 | 24.3 |
| Takeaways/game | 1.3 | 1.7 | 2.4 | 1.5 |
| Points allowed/game | 26 | 17.3 | 25.8 | 28.8 |
In 2015, it has gotten worse:
| 2015 | Sept | Oct | Nov | Dec |
| Yards allowed/game | 359.0 | 361.5 | 412.8 | 437.5 |
| First downs allowed/game | 20.3 | 20.8 | 23.3 | 24.5 |
| Takeaways/game | 2.7 | 2.8 | 0.5 | 1.0 |
| Points allowed/game | 21 | 18.5 | 34.3 | 31.5 |
In the past, former players have spoken out about feeling fatigued at the end of the season, a notion that Kelly has dismissed. However, the numbers above say it is an issue.
Getting back to snaps per game, the offense has the benefit of racking up big numbers because they run more plays than any team in the NFL. For example, in 2014, the Eagles' offense ran 1127 plays, which was the most in the NFL. In 2015, they ran 1037 plays, which is second-most.
Despite that massive advantage, they're only 15th in yards per game, and 16th in points per game. The defense's numbers, meanwhile, are predictably awful because of the number of snaps they have to face. They are 30th in yards allowed per game and 28th in points allowed per game.
The Eagles' offense has the advantage of running 1.5 games' more worth of plays than the average NFL team. The defense has the extreme disadvantage of facing almost two games' worth more. Therefore those "per game" numbers above are incredibly misleading.
A far better comparative measure to other teams around the league are "per drive" stats. On a "per drive" basis, the defense has been better both in 2014 and 2015:
| Offense, per drive - 2014 | Stat | Rank |
| Yards per drive | 31.43 | 14 |
| Points per drive | 1.98 | 13 |
| Turnovers per drive | 0.174 | 32 |
| Defense, per drive - 2014 | Stat | Rank |
| Yards per drive | 29.34 | 7 |
| Points per drive | 1.85 | 15 |
| Turnovers per drive | 0.134 | 15 |
| Offense, per drive - 2015 | Stat | Rank |
| Yards per drive | 28.99 | 26 |
| Points per drive | 1.60 | 24 |
| Turnovers per drive | 0.156 | 28 |
| Defense, per drive - 2015 | Stat | Rank |
| Yards per drive | 31.90 | 18 |
| Points per drive | 2.01 | 17 |
| Turnovers per drive | 0.141 | 8 |
If you think that "per drive" stats are merely something this author has latched onto, think again. The Eagles themselves measure their offensive and defensive efficiency on "per drive" stats, and the "per drive" stats say the defense has been significantly better.
Again, to be clear, Bill Davis' unit is not to be absolved of their share of the blame for this disaster of a season. However, when Kelly is a primary reason for the defense's failures, and his own unit has stunk all season long, there is no way the Eagles can justify firing Davis, but not Kelly.
Oh and by the way, if indeed the Eagles do fire Davis but keep Kelly, what self-respecting coach is going to accept a position coordinating an Eagles defense that is so absurdly set up for certain failure alongside Kelly?
Follow Jimmy on Twitter: @JimmyKempski
Add some PhillyVoice RSS feeds.