


January 25, 2018
 Daniel Craig/PhillyVoice
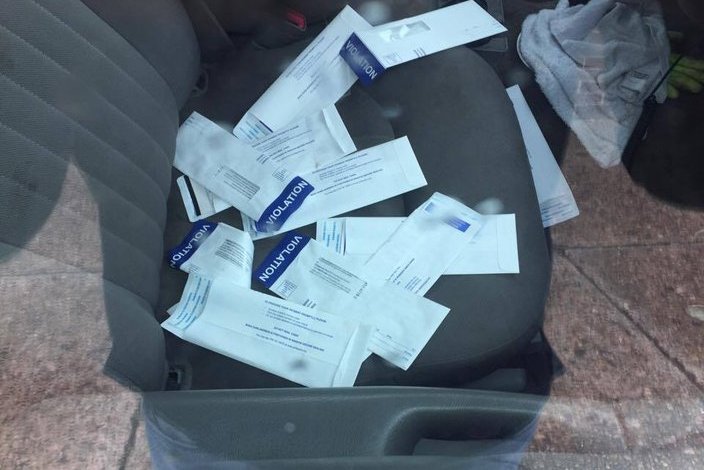
Parking tickets issued by the Philadelphia Parking Authority are scattered on the front seat of a truck illegally parked in the Mayfair neighborhood of Northeast Philadelphia.
Nick Hand's problem is twofold. He's looking for a job, and he — like many Philadelphians — has frequent trouble parking.
So, he figured out a way to showoff his tech skills and lower his chance at getting a parking ticket at the same time. The 28-year-old Voorhees, New Jersey, native recently moved to Northern Liberties after finishing his PhD. in astrophysics from UC Berkeley, and like the rest of us, he often struggles finding a spot.
"Parking is kind of a mess, as anyone who lives in the city knows," Hand told PhillyVoice.
One of the biggest hurdles for Philly drivers is the threat of a parking ticket. In his new, highly interactive data visualization and map, Hand shows where and when city drivers are most likely to receive a violation. The numbers are drilled down to the type of violation, day of the year, time of day, neighborhood and more.
Hand's charts and maps use public data sets provided by Open Data Philly. There have been similar visualizations of parking violations in the city, most notably the Philadelphia Parking Authority's own map released in 2015. But past attempts have focused more on annual analysis, Hand noted, making them more static and less useful to observe more minute trends.
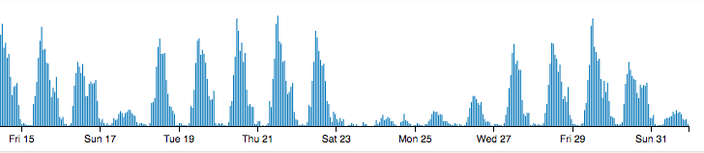
For example, Hand's website, which includes data from 2012-2016, defaults to January 2016 when you visit it. If you look at the day-to-day chart of violations that month, you'll notice a significant dip in the number of tickets issued starting around Jan. 23. That's right when a giant blizzard blanketed the region.
This chart shows the daily total parking violations in Philadelphia from 2016.
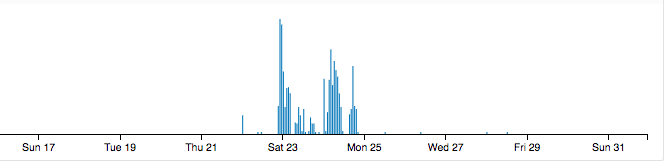
If you filter the chart's data to only display snow emergency route violations, however, you'll notice a considerable spike in those kinds of parking tickets issued around the same time, with no such violations the rest of the month.
This chart shows the snow emergency route parking violations in Philadelphia fro January 2016. Notice the spike around Jan. 23, when a giant blizzard hit the region.
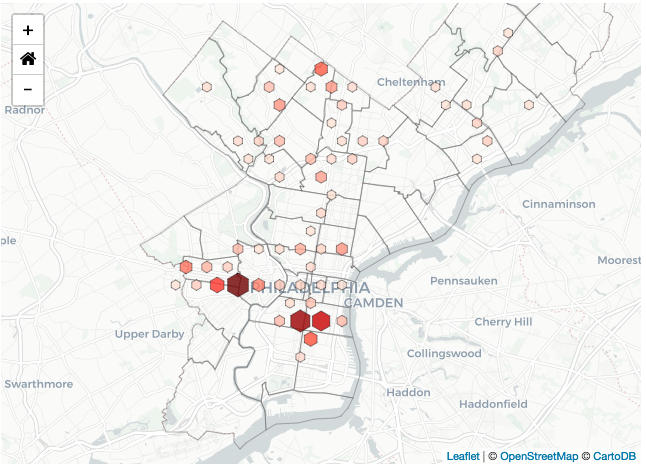
This map shows the location of snow emergency route parking violations in Philadelphia for January 2016.
A heat chart shows what times on weekdays that most tickets are issued. When you click on a specific time of day for a specific month, the rest of the charts respond, breaking down what zip codes the violations were issued in, what the violations were for, the total number of parking tickets and how much money was collected from those violations.
Hand currently is looking for jobs in data science, and making this map was partly an effort to pad his resume. Philly's "treasure trove" of open data, as he put it, made it easy to simply download a file from the city's website. He used JavaScript to make the visualization, a programming language he's less familiar with, so it also served as practice.
Ultimately, though, it's a helpful, easily accessible tool for residents curious about where they're most at risk for a ticket.
"The first thing I did was find my house and go, 'Where's my neighborhood?' It makes that a little bit easier of a thing, to find some hot spots and cold spots."
Some parting advice from Hand: If you work in Center City, be on alert from 11 a.m. to 2 p.m.