


October 24, 2016
 Source/Mapping Inequality
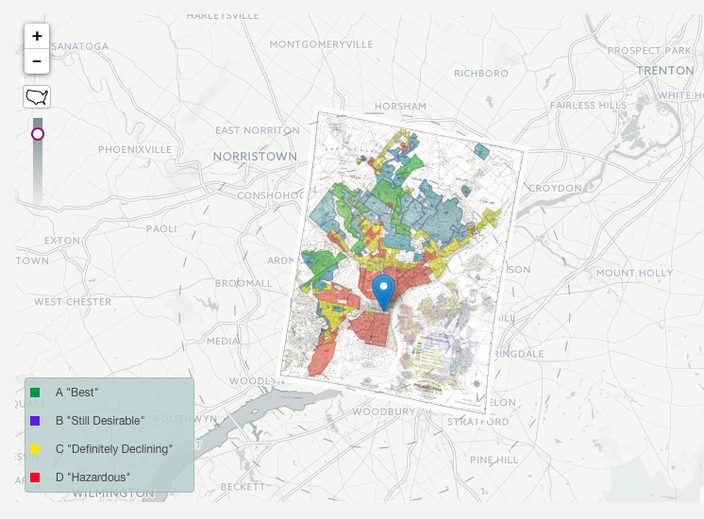
Map of Philadelphia based on "security risk" determined by the Home Owners' Loan Corporation (HOLC) between 1935-1940.
Hundreds of historical maps recently released by an organization chronicling the legacy of housing policies during the New Deal era of the United States paints a stark portrait of how real estate appraisers, mortgage lenders and developers drew sharp lines that charted the course of American cities.
Mapping Inequality provides an interactive tool that offers a graphic display of the classifications used by the Home Owners' Loan Corporation to assess the "security risk" of neighborhoods based on credit risk — and, presumably, factors such as racial demographics and crime.
These maps and their accompanying documentation helped set the rules for nearly a century of real estate practice. They have also served as critical evidence in countless urban studies in the fields of history, sociology, economics, and law. Indeed, more than a half-century of research has shown housing to be for the twentieth century what slavery was to the antebellum period, namely the broad foundation of both American prosperity and racial inequality.
Neighborhoods are grouped into four risk categories: Best, Still Desirable, Definitely Declining and Hazardous.
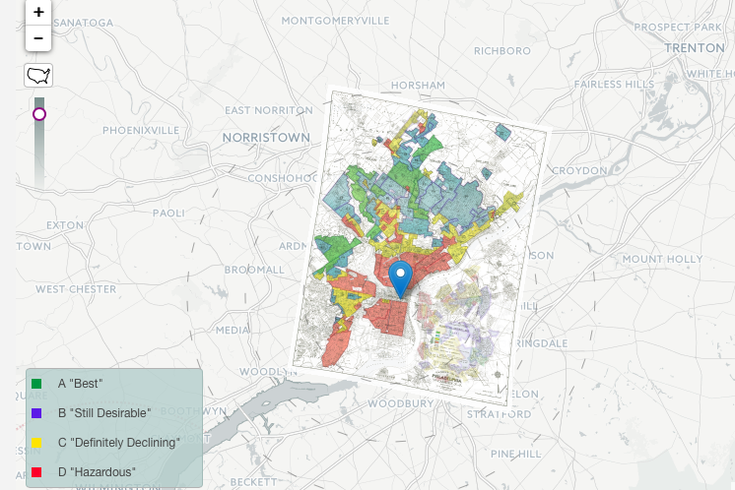
Map of Philadelphia based on “security risk” determined by the Home Owners' Loan Corporation (HOLC) between 1935-1940.
The goal of the Mapping Inequality project is to "learn at what costs such measures were realized" and to better understand the relationship between wealth and intergenerational poverty in America.