


April 25, 2015
The third annual Measure of America report from the Social Science Research Council was released Thursday. The report measures several factors concerning three categories of well being: education, health, and earnings.
The data compiled in the report is broken down by counties, allowing you to look at the statistics for each.
Using the data, here's a glance at some of the main statistics concerning Philadelphia county and the surrounding suburbs:
| Median Earnings | Life Expectancy (years) | School Enrollment (ages 3-24) | |
| Philadelphia | $27,392 | 74.7 | 75.2% |
| Bucks | $38,708 | 79.8 | 81.8% |
| Montgomery | $40,885 | 80.1 | 82.7% |
| Chester | $41,186 | 80.3 | 83% |
| Delaware | $34,217 | 78 | 81.6% |
You'll notice that Philadelphia County ranks far below the surrounding suburbs in several of these indicators. That contrast holds true when some of the other statistics are looked at, such as percentage of those below the poverty threshold, without health insurance, and suffering from diabetes.
| Poverty | Uninsured | Diabetes | |
| Philadelphia | 25.1 | 16.5 | 11.2 |
| Bucks | 4.9 | 8.8 | 9.1 |
| Montgomery | 5.6 | 8.1 | 8.2 |
| Chester | 6.2 | 9.5 | 8.1 |
| Delaware | 9.4 | 10.9 | 9.8 |
Philadelphia's poor scores on several of the health indicators could partly be explained by a key finding of the report, which stated that African Americans score very poorly in many of those statistics such as life expectancy and diabetes. Philadelphia County has a much larger African American population than any of the surrounding suburbs.
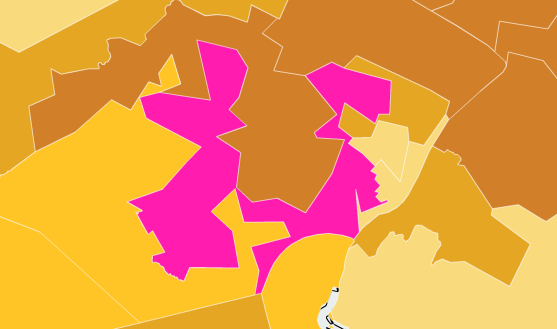
The overall Human Development Index, which weighs all of these factors to produce a score between 0 and 10, is not available for counties. However it is for congressional districts. Yet using districts can be hard for finding information about concentrated communities, mainly because of gerrymandering. For example, take a look at Pennsylvania's 7th District on the report's map (highlighted in pink), which contains sections of Montgomery, Chester, Berks, and Lancaster counties.
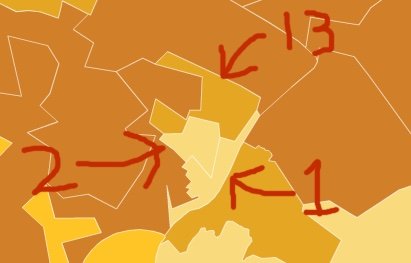
| HDI | Health | Education | Income | |
| U.S. Average | 5.03 | 5.36 | 4.97 | 4.77 |
| 1st | 4.27 | 4.17 | 4.05 | 4.60 |
| 2nd | 4.65 | 4.01 | 5.29 | 4.66 |
| 13th | 5.24 | 4.97 | 5.35 | 5.39 |