


July 14, 2016
The population of Philadelphia has grown modestly for nine consecutive years and counting, led by a relatively steady birth rate and an influx of immigrants.
Census data released earlier this year revealed that the Philadelphia metro area, including Wilmington and Camden, welcomed in 105,000 new residents between 2010 and 2015, among whom 50,000 were immigrants. That raises some interesting questions: where is everyone else coming from? And just where do the people who leave think they're going?
Obviously, the answer to both of these questions is New York City, so let's just get that out of the way.
A closer inspection of migration patterns, published Thursday in a new report by the Pew Charitable Trusts, breaks down census data from 2011-2013 and Internal Revenue Service data reflecting county-by-county domestic trends. The IRS information, retrieved from 2014 returns for the 2013 tax year, comes with a few limitations that ultimately understate total migration. Foreign nationals and low-income individuals who don't have to file tax returns are not included in the data.
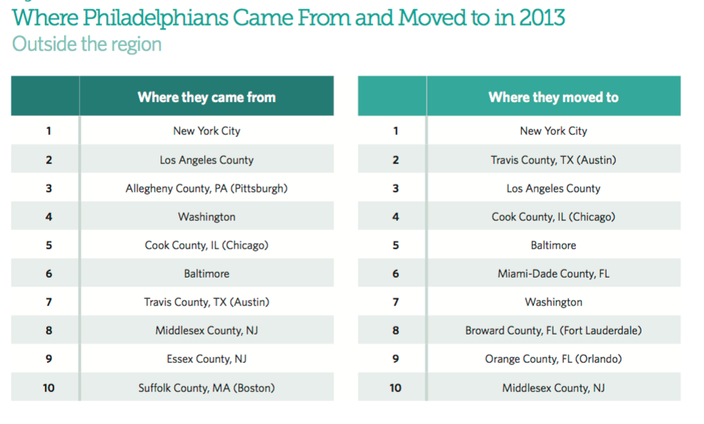
From an external standpoint, the table below shows where we're going and who's coming here, including the surrounding counties of Philadelphia and those from the suburbs surrounding other big cities.
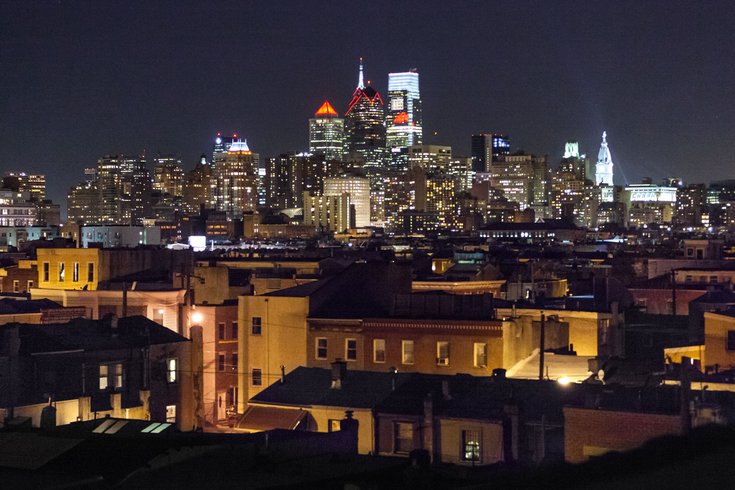
Coming and going from Philadelphia.
At the state level, most migrants tended to come and go from New York, Florida and Delaware, in that order. People who left Philadelphia locally settled most often in Montgomery, Delaware and Bucks counties instead of the four South Jersey counties — Burlington, Camden, Gloucester, and Salem — that fall within the greater metropolitan area.
One of the more eye-opening figures to emerge from the report is the percentage of families with school-age children who left Philadelphia.
Household breakdown of those leaving and arriving in Philadelphia.
"While the census did not ask people why they came to or left Philadelphia, these numbers appear to validate concerns, often expressed by civic leaders, about families leaving the city due to the ongoing problems of the public school system," the authors write.
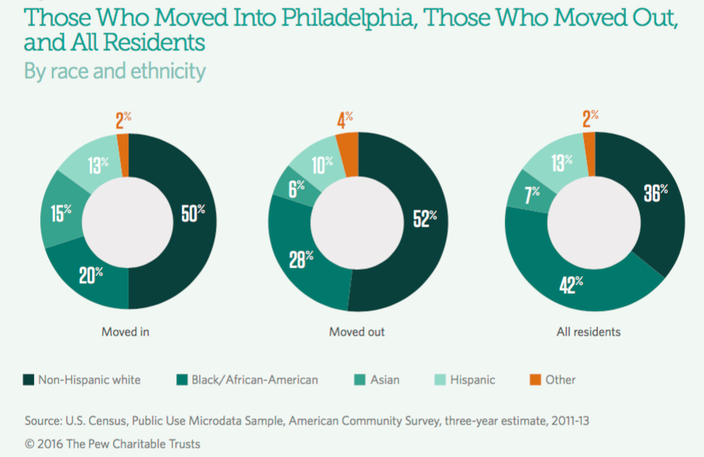
From the standpoint of race and ethnicity, roughly half of those who moved in and out were non-Hispanic white people. Fifteen percent of those who moved to Philadelphia between 2011-2013 were Asian and another 13 percent were Hispanic. By age, across all races and ethnicities, 38 percent of those who came here were between 18 and 24 years old. Those most likely to leave, representing 28 percent each, were between 25-34 and 35-64.
Curiously, Philadelphia's new arrivals are flocking most to Center City and neighborhoods to the southeast when measured relative to the total population. By comparison, the northern and eastern sections of the city saw fewer newcomers.
"Our analysis indicates that the people who have been moving into and out of Philadelphia are different from the population of the city as a whole," the authors conclude. "In particular, the incoming migrants are younger, better educated, more likely to be non-Hispanic white or Asian, and more likely to find housing in Center City and adjacent neighborhoods."