


March 20, 2016
 Source/Chester County Ramblings
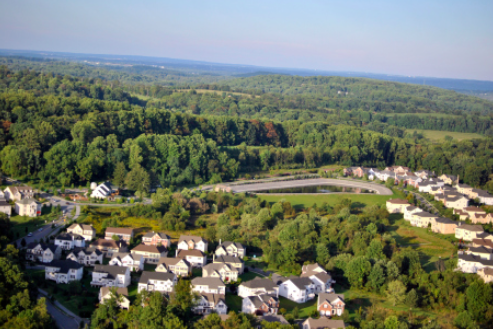
Aerial view of development in Chester County.
If you want to live a long life in the Delaware Valley, your best bet is to lay down roots in Chester, Montgomery or Bucks counties in Pennsylvania and Burlington County in South Jersey.
These are among the findings of the 2016 County Health Rankings, a national report produced annually by The Robert Woods Johnson Foundation and the University of Wisconsin Population Health Institute.
Since 2010, the study rankings have been compiled using a variety of health data sources to determine which counties in each state have the best overall health outcomes and where they rank across a range of health factors, from quality and length of life to behavioral, clinical and socioeconomic factors.
The table below displays length of life rankings for the region. In the study, that ranking accounts for 50 percent of each county's overall health score. The rankings are based in part on data from the National Center for Health Statistics and represent a compilation of several factors, including the number of deaths before age 75 and the years of potential life lost for people who die before turning 75.
| Regional Ranking |
County | State Ranking |
| 1 | Chester | 3 |
| 2 | Montgomery | 4 |
| 3 | Bucks | 9 |
| 4 | Burlington | 11 |
| 5 | Ocean | 14 |
| 6 | Delaware | 30 |
| 7 | Cape May | 18 |
| 8 | Gloucester | 15 |
| 9 | Salem | 21 |
| 10 | Atlantic | 19 |
| 11 | Camden | 17 |
| 12 | Cumberland | 20 |
| 13 | Philadelphia | 66 |
To provide a regional snapshot of the 2016 results, the table below shows how the 13 counties in Southeastern Pennsylvania and South Jersey stacked up overall in comparison to one another and relative to the rest of Pennsylvania and New Jersey. (Note: Red counties are in Pennsylvania, blue counties are in New Jersey).
| Regional Ranking |
County | State Ranking |
| 1 | Chester | 1 |
| 2 | Montgomery | 3 |
| 3 | Bucks | 6 |
| 4 | Burlington | 9 |
| 5 | Ocean | 11 |
| 6 | Delaware | 35 |
| 7 | Cape May | 15 |
| 8 | Gloucester | 16 |
| 9 | Salem | 17 |
| 10 | Atlantic | 18 |
| 11 | Camden | 19 |
| 12 | Cumberland | 21 |
| 13 | Philadelphia | 67 |
For the fifth year in a row, Philadelphia ranked at the very bottom both regionally and in Pennsylvania. As a metropolitan county vying against its more diversely developed neighbors, that shouldn't come as too great of a surprise. With a 12 percent "deep poverty" rate in 2015 – worst in the U.S. among the ten biggest cities – Philadelphia's overall scores are influenced both by the size of its population and the distribution of inequality that impacts various quality of life factors.
While 15 percent of Pennsylvanians statewide described their health as "fair or poor," that number peaked at 23 percent in Philadelphia and was lowest in Chester County at 11 percent. The study also looked at variations among different races, smokers vs. nonsmokers, incomes, access to physicians and healthy food, and people's commutes to work, among dozens of other factors.
Here are some key findings from Philadelphia:
• 37 percent of children in Philadelphia live in poverty, compared to a state average of 19 percent
• 59 percent of children are in single-parent households, compared to a state average of 33 percent
• Philadelphia received a ranking of 6.2 in income inequality based on the ratio of household income at the 80th percentile to income at the 20th percentile. That compares to 4.2 across the state.
• 17 percent of Philadelphians lacked medical insurance, compared to an average of 12 percent of residents statewide
The encouraging news for Philly is that, despite its bottom ranking, there are several key initiatives in place to address these issues through a combination of education and services. The Healthy Corner Store Initiative, launched in 2004 by The Food Trust, works with local grocers to market fresh produce while providing educational community programs to encourage healthy eating choices.
The University of Pennsylvania recently received a $1.4 million CDC grant to empower local leaders in the West Philadelphia Promise Zone to establish programs that address chronic health problems, from diabetes and hypertension to obesity.
And in May, the Opportunities Industrialization Center (OIC) and Philadelphians Organized to Witness Empower and Rebuild (POWER) will host an event, “Poverty Summit: Philly Solutions for Philly Poverty,” that seeks to develop local solutions in the labor market that could reduce financial strains that contribute to poor health and quality of life.
With five years of archived rankings now available, we created the following tables to show how counties across Pennsylvania and New Jersey have varied since the national study first began. For individual statistics, the County Health Rankings website allows you to compare each county to statewide averages and develop a clearer picture of where counties are strongest and weakest.
| 2016 Rank | County | 2015 Rank | 2010 Rank |
| 1 | CHESTER | 4 | 1 |
| 2 | Union | 1 | 3 |
| 3 | MONTGOMERY | 6 | 5 |
| 4 | Centre | 2 | 2 |
| 5 | Cumberland | 5 | 9 |
| 6 | BUCKS | 12 | 7 |
| 7 | Butler | 9 | 11 |
| 8 | Adams | 17 | 21 |
| 9 | Lancaster | 8 | 8 |
| 10 | Snyder | 7 | 4 |
| 11 | Cameron | 15 | 40 |
| 12 | Juniata | 3 | 28 |
| 13 | Franklin | 18 | 10 |
| 14 | Pike | 10 | 6 |
| 15 | York | 19 | 25 |
| 16 | Lebanon | 11 | 15 |
| 17 | Montour | 22 | 39 |
| 18 | Northampton | 27 | 26 |
| 19 | Lycoming | 23 | 23 |
| 20 | Westmoreland | 25 | 18 |
| 21 | Washington | 33 | 29 |
| 22 | Bedford | 13 | 31 |
| 23 | Bradford | 14 | 12 |
| 24 | Wayne | 31 | 62 |
| 25 | Berks | 20 | 16 |
| 26 | Allegheny | 34 | 49 |
| 27 | Huntingdon | 28 | 37 |
| 28 | Lehigh | 21 | 19 |
| 29 | Potter | 35 | 24 |
| 30 | Tioga | 16 | 22 |
| 31 | Fulton | 37 | 27 |
| 32 | Perry | 50 | 35 |
| 33 | Elk | 62 | 59 |
| 34 | Warren | 30 | 13 |
| 35 | DELAWARE | 39 | 36 |
| 36 | Clinton | 32 | 34 |
| 37 | Columbia | 38 | 14 |
| 38 | Somerset | 46 | 32 |
| 39 | Beaver | 43 | 44 |
| 40 | Forest | 65 | 53 |
| 41 | Venango | 52 | 54 |
| 42 | Indiana | 40 | 17 |
| 43 | Wyoming | 53 | 43 |
| 44 | Clearfield | 29 | 45 |
| 45 | Erie | 51 | 30 |
| 46 | Blair | 48 | 63 |
| 47 | Mercer | 41 | 52 |
| 48 | Monroe | 26 | 46 |
| 49 | Armstrong | 36 | 58 |
| 50 | Clarion | 24 | 42 |
| 51 | Dauphin | 45 | 47 |
| 52 | McKean | 47 | 50 |
| 53 | Susquehanna | 59 | 41 |
| 54 | Crawford | 44 | 33 |
| 55 | Mifflin | 42 | 48 |
| 56 | Jefferson | 54 | 20 |
| 57 | Northumberland | 49 | 55 |
| 58 | Carbon | 57 | 56 |
| 59 | Greene | 63 | 66 |
| 60 | Lackawanna | 56 | 51 |
| 61 | Schuylkill | 55 | 60 |
| 62 | Lawrence | 61 | 61 |
| 63 | Cambria | 60 | 64 |
| 64 | Luzerne | 58 | 57 |
| 65 | Sullivan | 66 | 38 |
| 66 | Fayette | 64 | 65 |
| 67 | PHILADELPHIA | 67 | 67 |
| 2016 Rank | County | 2015 Rank | 2010 Rank |
| 1 | Hunterdon | 1 | 1 |
| 2 | Morris | 3 | 3 |
| 3 | Somerset | 2 | 2 |
| 4 | Bergen | 4 | 4 |
| 5 | Sussex | 7 | 8 |
| 6 | Middlesex | 5 | 7 |
| 7 | Monmouth | 6 | 5 |
| 8 | Union | 9 | 12 |
| 9 | BURLINGTON | 11 | 6 |
| 10 | Warren | 10 | 10 |
| 11 | OCEAN | 8 | 13 |
| 12 | Hudson | 14 | 20 |
| 13 | Mercer | 12 | 9 |
| 14 | Passaic | 13 | 17 |
| 15 | CAPE MAY | 15 | 14 |
| 16 | GLOUCESTER | 16 | 11 |
| 17 | SALEM | 18 | 15 |
| 18 | ATLANTIC | 20 | 19 |
| 19 | CAMDEN | 19 | 16 |
| 20 | Essex | 17 | 18 |
| 21 | CUMBERLAND | 21 | 21 |
| 2016 Rank | County |
| 1 | Union |
| 2 | Centre |
| 3 | CHESTER |
| 4 | MONTGOMERY |
| 5 | Cumberland |
| 6 | Adams |
| 7 | Lancaster |
| 8 | Northampton |
| 9 | BUCKS |
| 10 | Pike |
| 11 | Franklin |
| 12 | York |
| 13 | Butler |
| 14 | Lehigh |
| 15 | Berks |
| 16 | Lebanon |
| 17 | Cameron |
| 18 | Columbia |
| 19 | Snyder |
| 20 | Juniata |
| 21 | Bradford |
| 22 | Lycoming |
| 23 | Potter |
| 24 | Monroe |
| 25 | Westmoreland |
| 26 | Dauphin |
| 27 | Allegheny |
| 28 | Huntingdon |
| 29 | Wayne |
| 30 | DELAWARE |
| 31 | Clinton |
| 32 | Tioga |
| 33 | McKean |
| 34 | Warren |
| 35 | Washington |
| 36 | Forest |
| 37 | Clearfield |
| 38 | Fulton |
| 39 | Erie |
| 40 | Indiana |
| 41 | Somerset |
| 42 | Jefferson |
| 43 | Mercer |
| 44 | Montour |
| 45 | Northumberland |
| 46 | Clarion |
| 47 | Blair |
| 48 | Venango |
| 49 | Elk |
| 50 | Bedford |
| 51 | Crawford |
| 52 | Beaver |
| 53 | Armstrong |
| 54 | Perry |
| 55 | Lackawanna |
| 56 | Greene |
| 57 | Mifflin |
| 58 | Wyoming |
| 59 | Lawrence |
| 60 | Carbon |
| 61 | Cambria |
| 62 | Luzerne |
| 63 | Susquehanna |
| 64 | Schuylkill |
| 65 | Fayette |
| 66 | PHILADELPHIA |
| 67 | Sullivan |
| 2016 Rank | County |
| 1 | Hunterdon |
| 2 | Somerset |
| 3 | Bergen |
| 4 | Morris |
| 5 | Middlesex |
| 6 | Monmouth |
| 7 | Union |
| 8 | Hudson |
| 9 | Sussex |
| 10 | Passaic |
| 11 | BURLINGTON |
| 12 | Warren |
| 13 | Mercer |
| 14 | OCEAN |
| 15 | GLOUCESTER |
| 16 | Essex |
| 17 | CAMDEN |
| 18 | CAPE MAY |
| 19 | ATLANTIC |
| 20 | CUMBERLAND |
| 21 | SALEM |
For more information on the 2016 rankings, head over to the County Health Rankings website, which also offers guides and tools to help governments and community organizations address their most pressing areas of need.
PhillyVoice Managing Editor of Curation Jon Tuleya contributed to this article.