


January 30, 2017
As visually evident as Philadelphia's growth and future promise have become over the past decade, any discussion of the state of the city would be beyond negligent to ignore the prevalence of poverty within its limits. Saddled with the highest rate of "deep poverty" among America's ten most populous cities, Philadelphia's profile as a rising star is shaded by decades of declining financial stability and opportunity for its most vulnerable residents.
Much of this has been driven by the fiscal foundations of our local government, according to a report published Monday by the Center City District and the Central Philadelphia Development Corporation.
In a multi-decade study of each of Philadelphia's ten council districts, the report examines how the overwhelming majority of Philadelphia's economic and population growth have been concentrated in Center City and University City, while other neighborhoods have seen declines in employment and standards of living.
Philadelphia declined from a city of 1.9 million to 1.5 million and the reduction in the denominator (the total population) pushed the poverty rate up to 23 percent by 2000. Had there not been a loss of a half-million working- and middle-class residents and a loss of 255,244 jobs during these three decades, Philadelphia’s poverty rate would have been 17 percent in 2000.
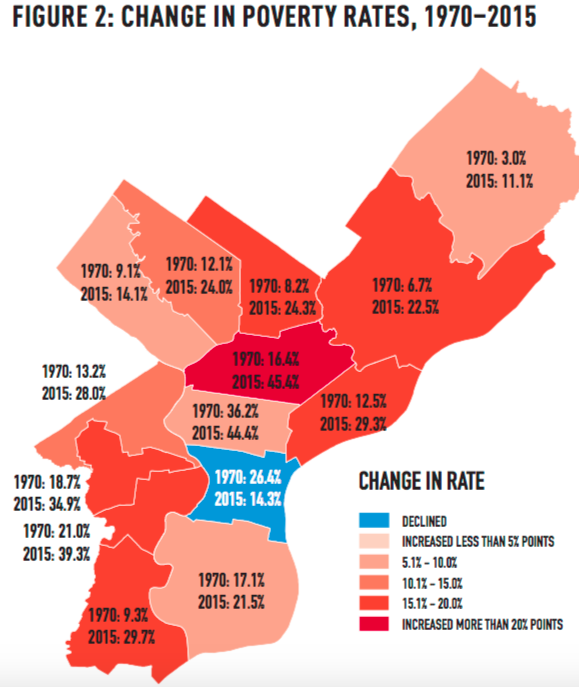
A review of demographic and employment trends from 1970 to 2015 reveals that Philadelphia's deepening poverty rate has been less a reflection of more people living in poverty than a consequence of middle-class and working-class families relocating to surrounding suburbs. Rates of poverty in Philadelphia's ten council districts, as shown in the map below, have risen everywhere except for Center City.
Poverty rates in Philadelphia (1970-2015).
Here's where each of Philadelphia's council districts stood in terms of poverty by 2015.
Poverty rates in Philadelphia's council districts (2015).While Philadelphia draws 19 percent of its municipal budget from the property tax (36 percent in Washington, D.C., 43 percent in New York City), 65 percent of the budget comes from wage and business taxes (33 percent in New York City).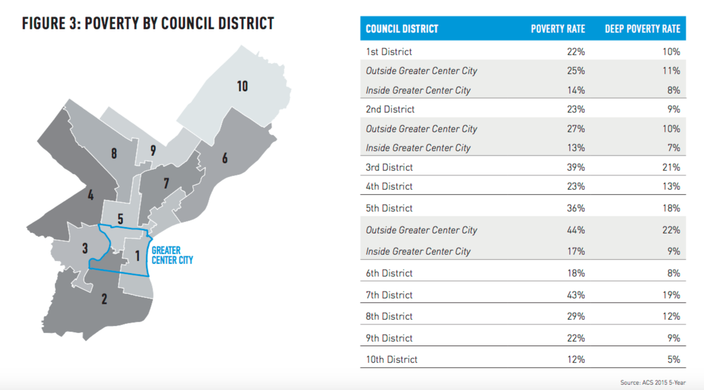 Source/Center City District
To achieve a citywide revival, the report argues that the only broad-based solution to the city's underlying problem is to come to terms on bi-partisan tax reform legislation.
"This is a moment of choice," the authors state. "Philadelphia now competes for workers and residents in a global economy with fast-changing technologies and highly mobile firms. We have extraordinary amenities and innate advantages. But we have held on to an antiquated tax structure, forged in an era when industries rarely moved and workers had limited choice."