


February 28, 2016
 Thom Carroll/for PhillyVoice
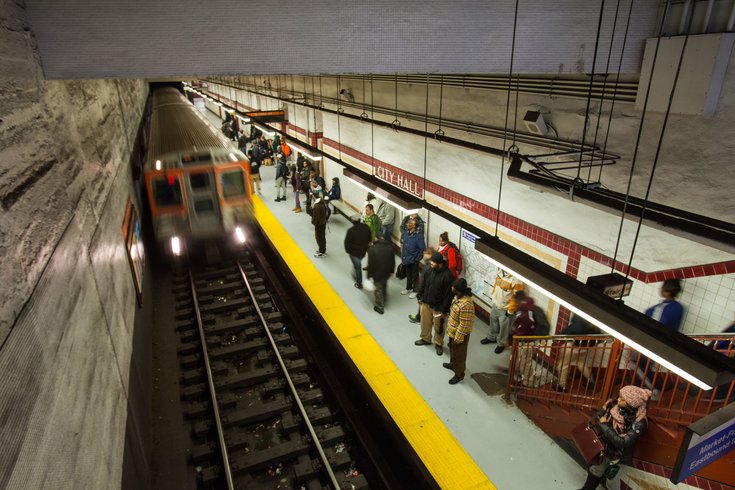
A SEPTA subway departs south on the Broad Street Line from the City Hall Station.
A new analysis of public transportation systems in cities across the United States places Philadelphia at number nine, citing its high volume of work commuters and a full suite of options including underground subways, street-level trolleys, buses, and commuter rails.
The study, conducted by financial data cruncher Smart Asset, was prompted by research out of Texas A&M University that found the average U.S. driver spends an agonizing 42 hours per year in traffic, costing each person $960 per year in delays. In the 15 biggest U.S. metro areas, it's even worse: 63 hours per year in traffic and an annual loss of $1,433 per driver.
Given those drawbacks, the study sought figure where urban residents can best rely on the alternatives provided by their city's public transportation systems.
The study analyzed public transportation data from the U.S. Census Bureau in 2014, calculating the averages of five key metrics in order to produce scores indexed at 100. The first two metrics gauged the efficiency of each transit system: What's the average commute time for transit users and what's the percentage difference between that figure and the average commute time for drivers?
In Philadelphia, the average commute time for transit users was 44 minutes compared to 30.1 minutes for drivers, with a percentage difference of 46 percent.
The third and fourth metrics analyzed the availability of each city's public transit: What percentage of commuters use public transit and how many commuters, in total, rely on it to get around.
This is where Philly earned its place in the top ten, with 171,000 public transit commuters comprising the fourth highest number of any U.S. city (and that's excluding people who come to the city from the suburbs on regional rail). On a typical weekday, SEPTA trains accounted for 290,000 rides, while buses and trolley buses contributed another 490,000 rides. Among all commuters, 27 percent of Philadelphians rely on public transportation
Finally, to measure overall quality, the analysis looked at the difference between citywide median incomes and the median income of transit users. In this case, Philadelphia had a 16 percent difference in citywide median income and the median income of those who use public transportation.
All told, Philadelphia came out with an index of 92.87, just behind Pittsburgh at 93.17. The top ten cities are as follows.
1. Washington, D.C.
2. San Francisco
3. Boston
4. Chicago
5. New York City.
6. Seattle
7. Jersey City
8. Pittsburgh.
9. Philadelphia.
10. Oakland
A key finding from the analysis was that the total number of transit users jumped 9 percent since 2011 in the 136 cities studied by Smart Asset. Out west, in cities like San Jose, Dallas and Seattle, ridership increased by more than 20 percent.
The top ten ranking for Philadelphia is consistent with data from SEPTA, which announced last year that it hit record high ridership during fiscal year 2015 with 37.4 million trips taken on Regional Rail lines alone. The transit agency, which had a balanced budget for the sixteenth straight year, is also preparing to launch a massive fare overhaul, SEPTA Key, that will likely help attract new riders as it continues to modernize and improve its operations.