


November 10, 2016
 Office of Innovation and Technology, GIS Services Group /Carto
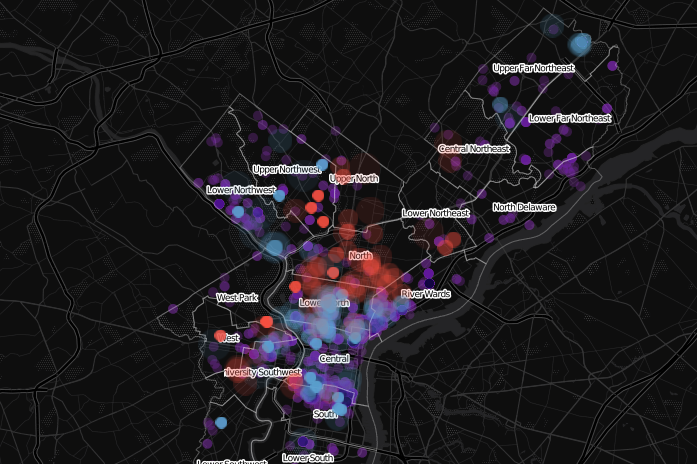
A screenshot of a time-lapse map that shows demolitions and new construction across Philadelphia over a 13-year period.
Anyone who frequently walks around Philadelphia knows the city is constantly evolving. New construction seems to be going up on every block, and older buildings are torn down to make way for more development.
A new time-lapse map shows when and where that development has taken place across Philly over the past 13 years.
Using data from the Department of Licenses and Inspections, the map was created by the city’s Geographic Information Systems Services Group and the Office of Innovation and Technology. It shows new construction and demolitions from the fall of 2003 up until October 2016.
You can watch the entire time-lapse in a GIF below, or you can use the interactive map here.
Time-lapse map showing 13 years of demolitions and new construction in Philly.