


April 29, 2025
Every day between the end of the Sixers' regular season and the NBA Draft Lottery on May 12, we will use Tankathon.com's famous simulation tool to run through the lottery 10 times. Over a 29-day period, we will collect a significant sample of possible outcomes and track those results as the Sixers wait to learn the fate of their own first-round pick.
The Sixers are entering the lottery with the fifth-best set of odds, but they will only keep their first-rounder if it falls in the top six slots due to an obligation to the Oklahoma City Thunder from a trade made nearly five years ago.
Let's get to today's simulations:
The outcomes of today's batch of 10 simulations:
• Simulation No. 1: 3rd pick
• Simulation No. 2: 6th pick
• Simulation No. 3: 1st pick
• Simulation No. 4: 3rd pick
• Simulation No. 5: 2nd pick
• Simulation No. 6: 3rd pick
• Simulation No. 7: 8th pick
• Simulation No. 8: 4th pick
• Simulation No. 9: 1st pick
• Simulation No. 10: 6th pick
MORE: Joel Embiid year-in-review
This was an incredible batch of simulations for the Sixers after perhaps the worst of the bunch yesterday, with a 9-for-10 success rate keeping their pick and two lottery victories.
If you are interested in how adding Cooper Flagg would change the Sixers' rotation and roster next season, I have a mailbag for you.
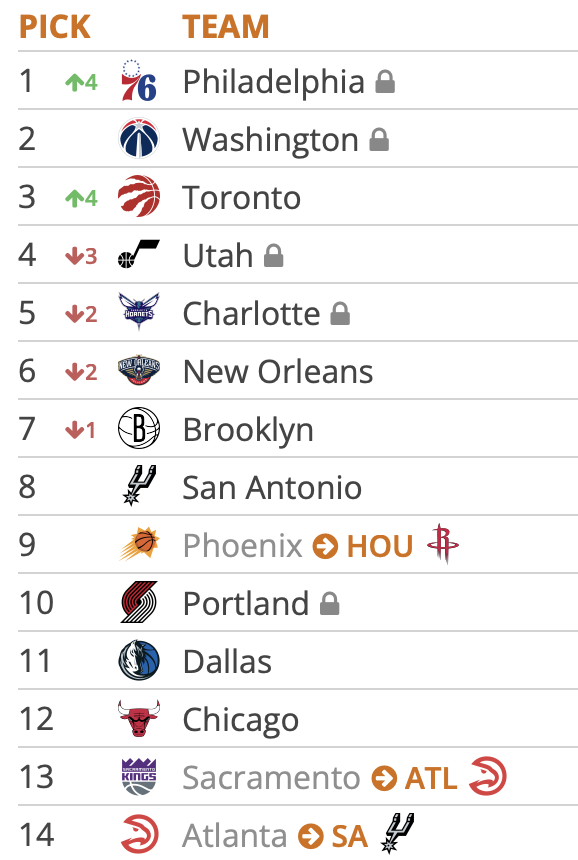
The only bad outcome of this batch was very bad: the Toronto Raptors land Flagg, while the Brooklyn Nets are one of two other teams to leapfrog the Sixers:
The Sixers, of course, spent the last two months of the season outpacing Brooklyn and Toronto in the tanking race.
The cumulative results of this exercise so far:
| Draft Pick | Simulation Outcomes | Simulation Outcome Percentage | Actual Percentage Odds |
| 1 | 18 | 11.2% | 10.5% |
| 2 | 19 | 11.8% | 10.5% |
| 3 | 14 | 8.7% | 10.6% |
| 4 | 19 | 11.8% | 10.5% |
| 5 | 5 | 3.1% | 2.2% |
| 6 | 29 | 18.1% | 19.6% |
| 7 | 42 | 26.2% | 26.7% |
| 8 | 13 | 8.1% | 8.7% |
| 9 | 1 | 0.6% | 0.6% |
| Keep or Lose Pick? | Simulation Outcomes | Simulation Outcome Percentage | Actual Percentage Odds |
| Kept Pick | 104 | 65.0% | 64.0% |
| Lost Pick | 56 | 35.0% | 36.0% |
MORE: Jared McCain year-in-review
Follow Adam on Twitter: @SixersAdam
Follow PhillyVoice on Twitter: @thephillyvoice