


June 14, 2017
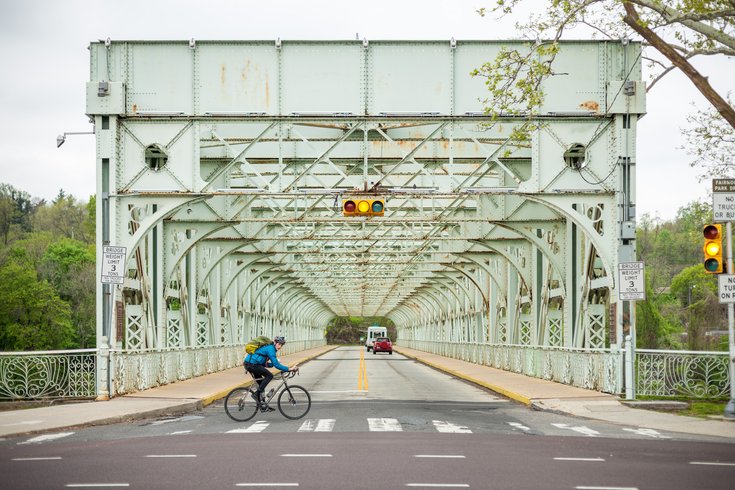 Thom Carroll/PhillyVoice
Following the Schuylkill River Trail, a cyclist bikes past the East Falls Bridge along Kelly Drive in the East Falls section of Philadelphia.
As Philadelphia’s bike-share program Indego expands to 14 new kiosks this summer, prospective riders are nonetheless confronted with the dangerous reality that comes when biking in an urban environment. This reality became even more startling on Monday when a Citi Bike rider in New York was killed following a bus crash.
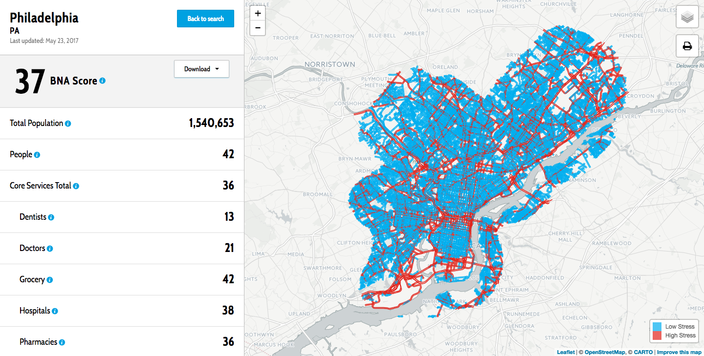
When it comes to the stress of being part of a city’s biking community, Philadelphia does slightly better than New York, according to a new data mapping project from PeopleForBikes. The difference isn’t tremendous, though: New York scores a 30 out of 100 in its Bike Network Analysis score, while Philadelphia scores a 37.
The Bike Network Analysis map currently surveys 299 U.S. cities, compiling scores based on U.S. Census data and OpenStreetMap to analyze the connectivity of city destinations for bike commuters. The data takes census data about jobs to trace common travel routes and the types of bicycle facilities on different streets. The more easily bikers can access their apartments, jobs, shopping, schools, food and health care, the better the city’s score.
With the app still in evolving stages, it seems PeopleForBikes is aware of the margin of error the data collection could yield, even publicly posting its source code and staying open to feedback now through July 14.
The Bike Network Analysis (BNA) score for Philadelphia is 37. Red areas of the map indicate higher stress levels for cyclists.
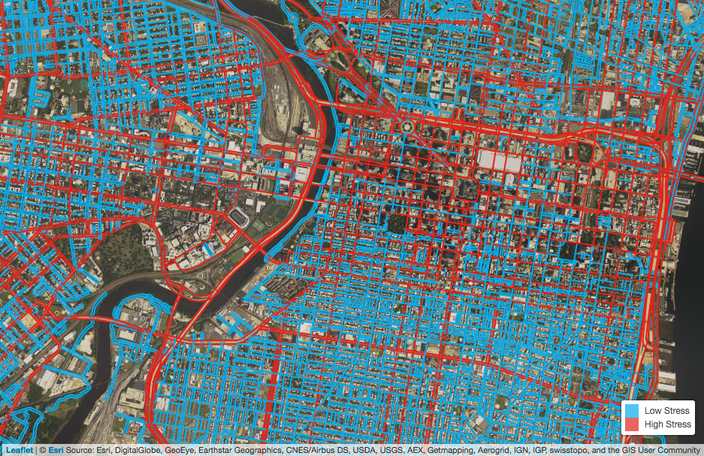
A more detailed satellite map of Center City and surrounding areas.
The maps also categorize data to showcase successes and discrepancies in access to different facilities. The average for how well people can reach core services by bike – dentists, doctors, grocery stores – was 36 in Philadelphia. Worst among core services was the access to dentists, which scored just 13, while social services scored highest with 58.
Access to educational and employment opportunities by bike scored slightly higher, with an average of 40. Vocational and technical colleges scored the lowest, at 17, while K-12 schools scored best at 63.
Of the cities and towns included in the map, the best BNA score comes out of Rexburg, Idaho, which scored an 80. Rounding out the top 10 scores is Marquette, Michigan, with a BNA of 51.
Among the worst cities for bikers is Brielle, New Jersey, with a BNA of six. Though Philly's score towers over that and several others in areas like Buffalo, New York, (BNA: 7) and Springfield, Illinois, (BNA: 8) it's important to consider the greater amount of facilities in Philadelphia compared to smaller areas, which helps inflate its score.
Of the nation’s more major cities, Memphis, Tennessee, was among the lowest with a BNA of 10.
You can play around with Philadelphia’s map features on the site, highlighting different districts and areas where biking ease varies.