


March 16, 2016
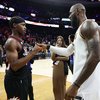
 Charlie Neibergall/AP
The first round of the NCAA Tournament gets underway at 12:15 p.m. on Thursday.
The NCAA Tournament is a yearly reminder of all the things make sports, well, sports -- underdogs, buzzer-beaters, etc. And the first weekend is like a four-day binge-fest that tops any Sunday you've spent glued to the Red Zone or your own personal House of Cards marathon.
But March Madness is also a reminder of all the things that have turned sports from games into business. Big business.
From the coaches' salaries to the ever-growing cost of broadcast rights, March Madness is like a Darren Rovell nocturnal emission — full of stadium food updates, merchandise options and second-market ticket prices — from which we can't escape. And that doesn’t event count the brackets.
Oh, the brackets...
Calm down, Darren.
The amount of money bet on the tournament is mind blowing -- $9 billion last year -- but that's only a small fraction of the financial monster that is March Madness. And the people over at communitytax.com put together an infographic that does a really nice job of illustrating just how much is spent, including over a billion dollars in advertising.
The passion for this college basketball tourney is unbelievable, a fact highlighted in the infographic’s cache of statistics. Employers beware in March; United States employers are projected to lose about $1.9 billion from unproductive workers due to March Madness alone. That’s nothing compared to the $9 billion that will be spent on betting for the events this year—never mind the fact that $2.5 million of that is illegally bet. Even the hospitality industry capitalizes on this month-long tournament, as Las Vegas hotels will hit an astronomical 98% occupancy during the first weekend of March Madness alone, a fact which makes this one of the Top 5 marketing events of the year. [communitytax.com]
As you can see from the infographic below, everyone seems to be getting a cut, except for the kids that are actually playing the games, but that's another story for another day...

Follow Matt on Twitter: @matt_mullin