


January 17, 2020
 Thom Carroll/PhillyVoice
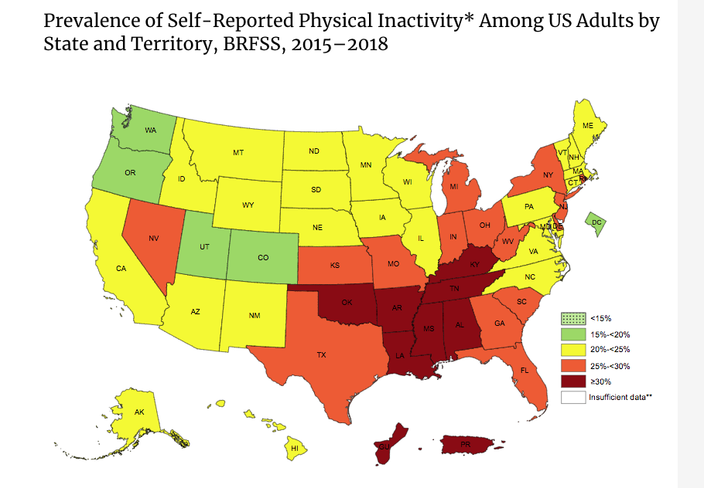
More than 1 in 4 New Jersey adults are physically inactive, placing them at higher risk for various adverse health conditions, according to the U.S. Centers for Disease Control and Prevention, which mapped physical inactivity prevalence rates across the United States.
More than 1 in 4 New Jersey adults are physically inactive, placing them at greater risk for a multitude of adverse health conditions.
New Jersey has the 11th highest percentage of physically inactive residents in the United States, according to the U.S. Centers for Disease Control and Prevention, which mapped physical inactivity in all 50 states, Puerto Rico, Guam and Washington, D.C.
About 29% of New Jersey adults are physically inactive, defined by the CDC as the failure to participate in any liesure-time physical activities within the last month. Those activities range from gardening to running.
Pennsylvania adults did not fare much better – nearly 25% are physically inactive, the 25th highest figure in the U.S.
Colorado was the most active state, with only 17% of adults physically inactive. Puerto Rico fared the worst by far, with nearly half its adult residents inactive.
U.S. health officials recommend adults get at least 150 minutes of moderately-intense aerobic physical activity or 75 minutes of vigorous aerobic exercise each week. They also recommend adult perform muscle-strengthening exercises at least two days as week.
"Too many adults are inactive and they may not know how much it affects their health" Dr. Ruth Petersen, director of the CDC's division of nutrition, physical activity and obesity said in a statement. "Being physically active helps you sleep better, feel better and reduce your risk of obesity, heart disease, type 2 diabetes and some cancers."
This map depicts the differing physical inactivity prevalence rates across the United States.
To map physical inactivity, the CDC relied on 2015-2018 data from the Behavioral Risk Factor Surveillance System, an ongoing state-based telephone interview survey.
The CDC also found significant demographic differences in mapping physical inactivity. In most states, including Pennsylvania and New Jersey, black and Hispanic adults had higher rates of physical inactivity than white adults.
See the physical inactivity levels of each state here.
Follow John & PhillyVoice on Twitter: @WriterJohnKopp | @thePhillyVoice
Like us on Facebook: PhillyVoice
Add John's RSS feed to your feed reader
Have a news tip? Let us know.